Using launch arguments for easier Core Data and SwiftData debugging
Published on: December 1, 2019Updated on: June 27, 2025
If you use Core Data or SwiftData in your apps, you might be aware that the larger and more complicated your set up becomes, the harder it is to debug. It's at this point where you might start to get frustrated with your persistence framework and its black-box kind of implementation. You might think that you simply have to trust that Core Data (or SwiftData) will do the ideal thing for your app.
Furthermore, you might have a set up with multiple managed object contexts, each confined to its own thread. And when your app crashes sometimes, you think it's related to Core Data in one way or the other, but you're not quite sure how to debug it. Especially because your app only crashes sometimes rather than all the time.
In this post, I want to show you some Core Data related Launch Arguments that will help you debug and validate your Core Data related code. Let's start by using Launch Arguments to see what Core Data does under the hood. Next, we'll see how to detect most of your threading problems in Core Data.
Knowing what's happening under the hood
Sometimes, you want to open the underlying SQLite for your app file to see whether your data is actually stored as expected, or maybe you want to inspect the database structure. To do this, you need to know where the underlying SQLite file is stored which can be especially challenging when you're running on the simulator. Because let's be honest, we don't know what the UUID of our simulator is and we most certainly don't want to have to figure out its location every time we need to find our SQLite file.
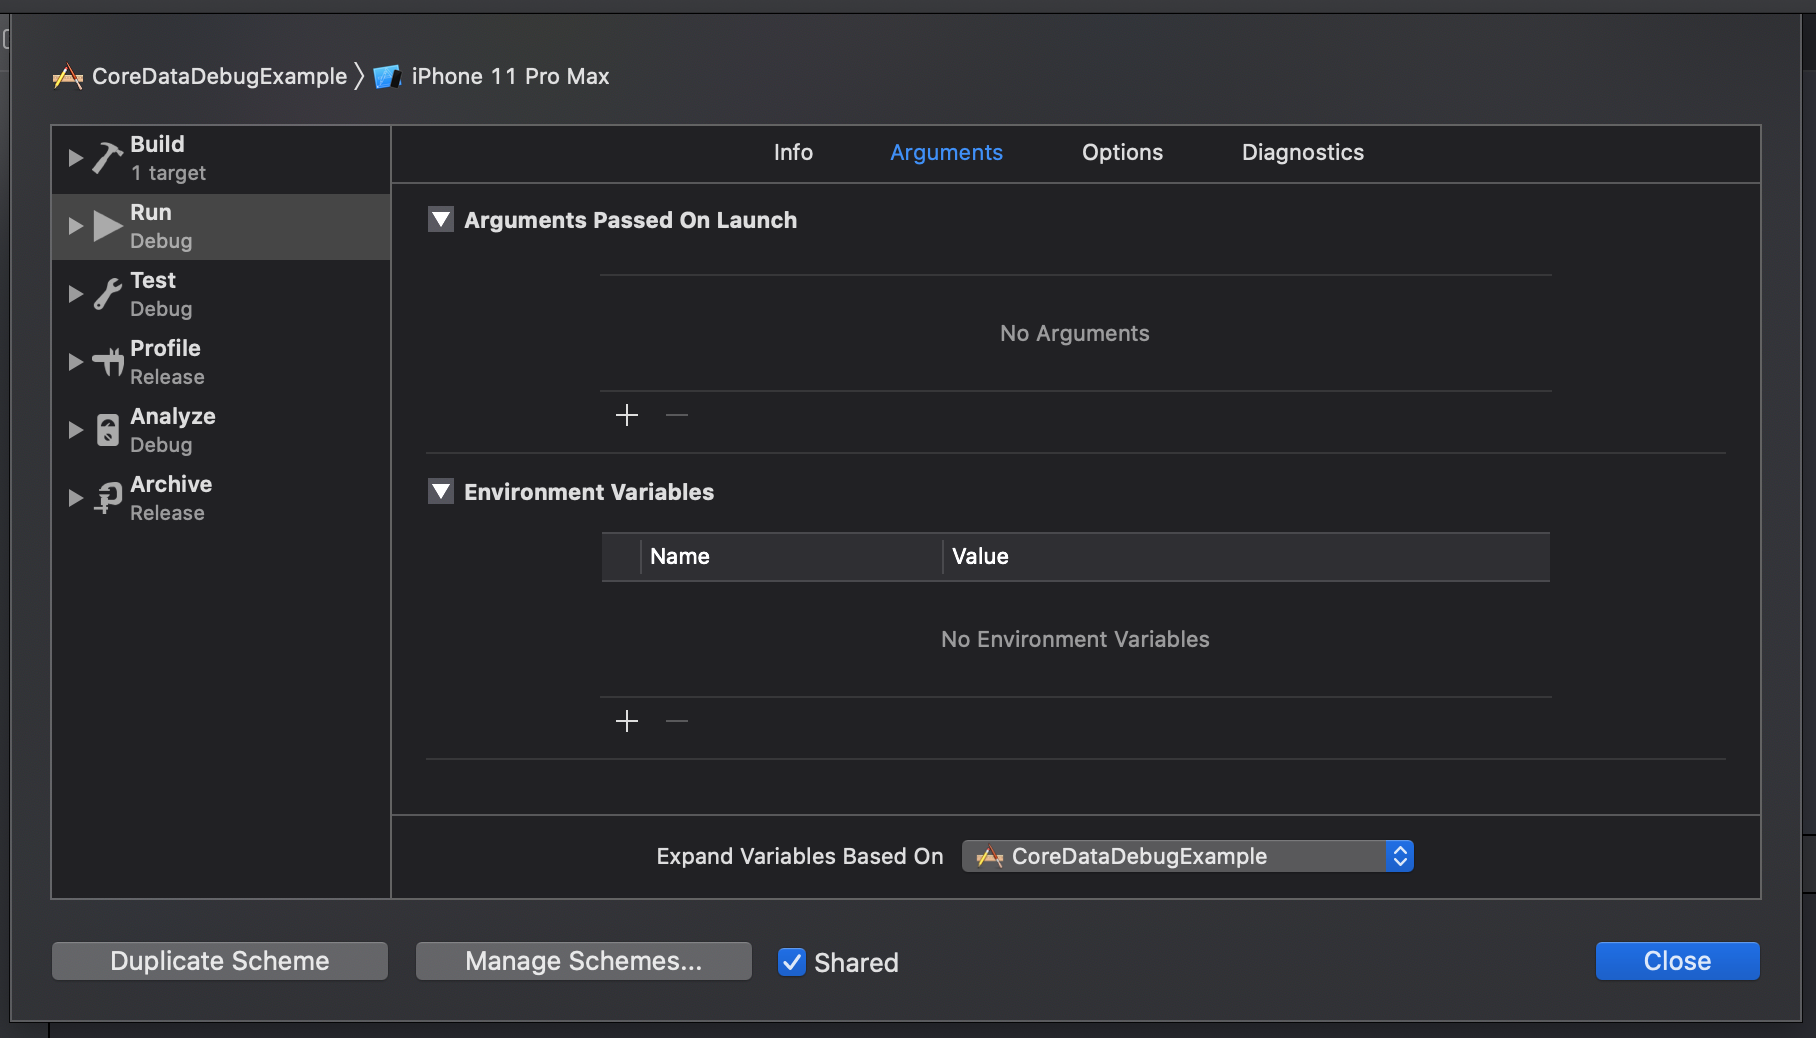
Luckily, you can use a Launch Argument to log some information to the console. To add a Launch Argument, use to top menu in Xcode to go to Product -> Scheme -> Edit Scheme... (cmd + >). Select the Run configuration and go to the Arguments tab as shown in the following screenshot:
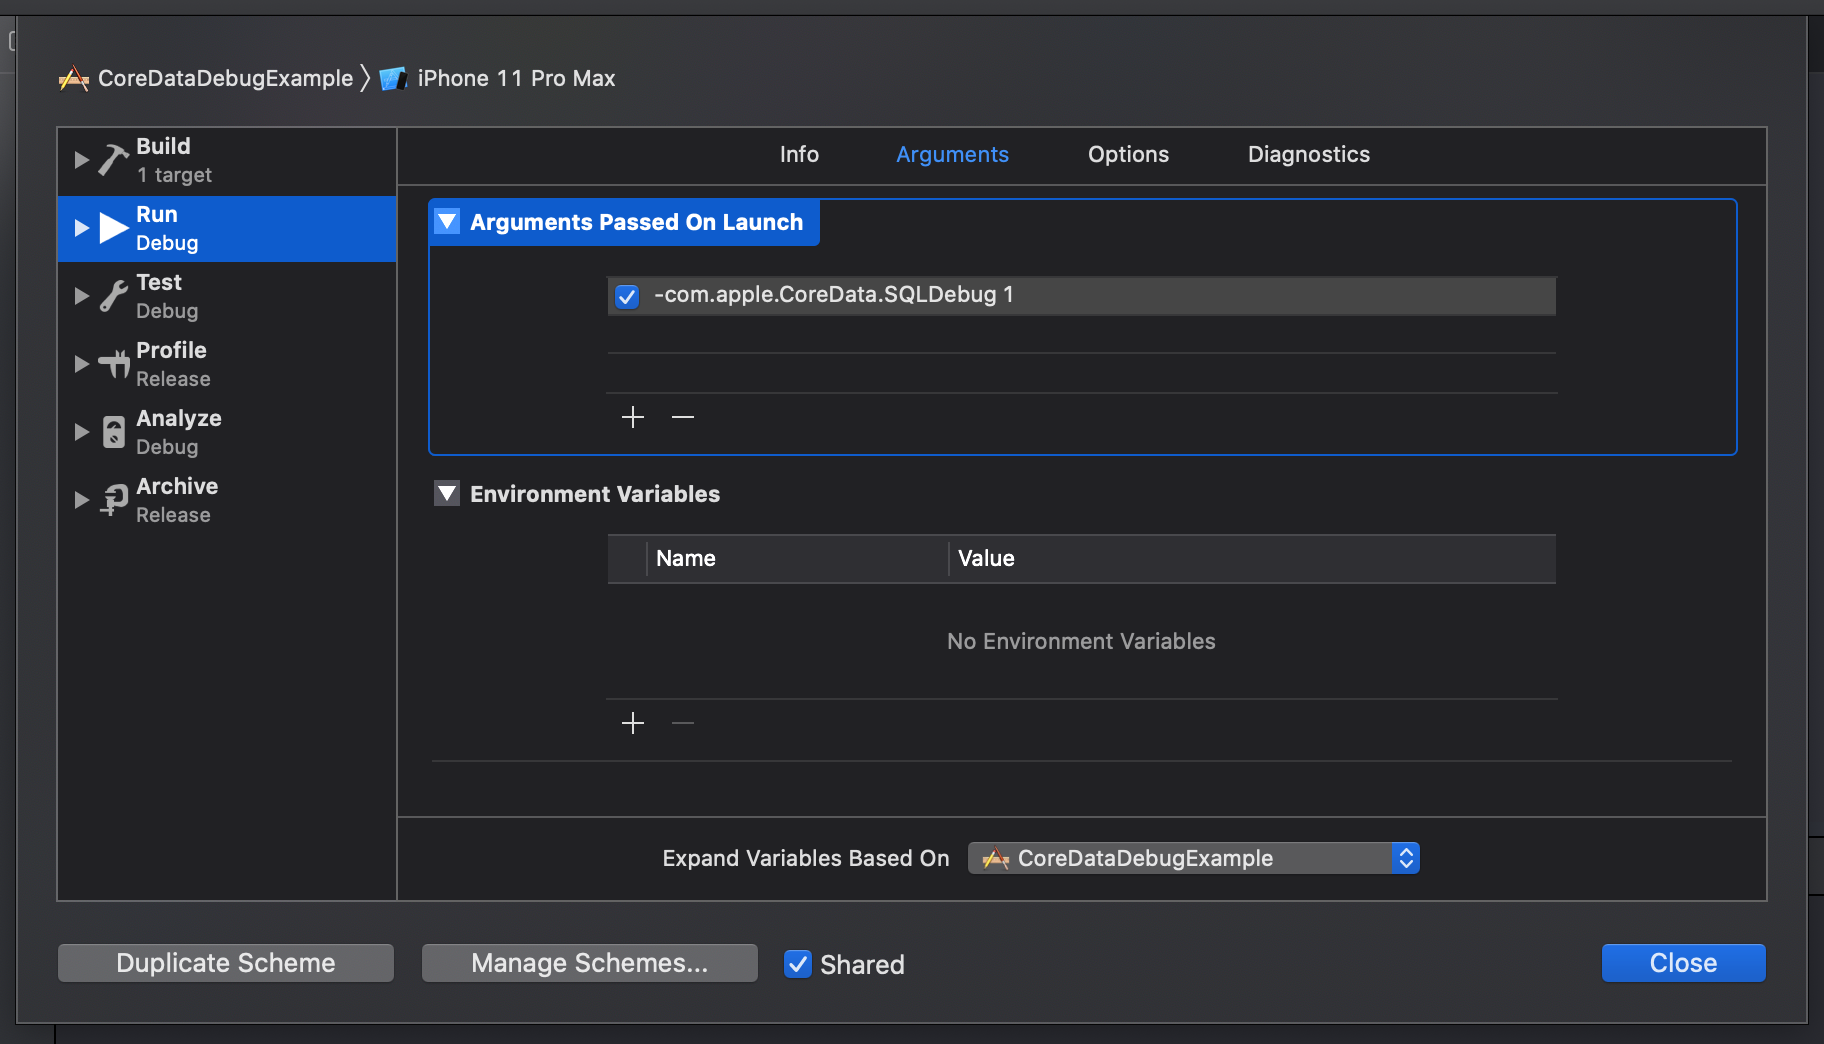
To get information logged to the console, click the + button under the Launch Arguments and add the following argument:
-com.apple.CoreData.SQLDebug 1The result should look as follows:
If you run your app after setting this Launch Argument, Core Data and SwiftData will start logging basic information like where the backing SQLite file is stored, and what queries are executed.
You can increase the log level all the way up to level 4, at that point the system will log pretty much everything you might want to know about what's going on under the hood and more. For example, this might help you notice that your app is performing lots of SQLite queries to fetch object relationships. And based on that discovery you might decide that certain fetch requests or queries should automatically fetch certain relationships by setting your fetch request's relationshipKeyPathsForPrefetching property.
In case you're curious, the following list describes the different Core Data SQLDebug log levels:
- SQL statements and their execution time
- Values that are bound in the statement
- Fetched managed object IDs
- SQLite EXPLAIN statement
These four log levels give you a lot of information that you can use to improve your apps. Of course, the usefulness of certain log levels like level four depends entirely on your knowledge of SQLite. But even if you're not well versed in SQLite, I recommend to take a look at all of the log levels sometimes, they can produce some interesting outputs.
Detecting threading problems in Core Data
One of the biggest frustrations you might have with Core Data is random crashes due to threading problems. You're supposed to use managed object context and managed objects only on the threads that they were created on, and violating this rule might crash your app. However, usually your app won't crash and everything is fine. But then every now and then a random crash pops up. You can tell that it's Core Data related but you might not be sure where the error is coming from exactly.
Luckily, the Core Data team has thought of a way to help you get rid of these crashes. In Xcode, you can add the -com.apple.CoreData.ConcurrencyDebug 1 Launch Argument to run Core Data in an extra strict mode. Whenever Core Data encounters a threading violation, your app will immediately crash and Xcode will point out the exact line where the violation occurred.
I can recommend everybody to use this Launch Argument in development because it will help you catch threading problems early, and forces you to fix them right away rather than getting some nasty surprises when your app is already published to the App Store.
In Summary
While you can’t eliminate all bugs and performance issues with debug flags, it does help to have some tools available that you can use to make your problems more visible. Whether it's making you app crash if you break Core Data's threading rules, or gaining insights into the different SQLite queries Core Data does under the hood, it's always good to understand how your code behaves under the hood.
One of the nicer things about SwiftData being built on top of Core Data is that all of these debug arguments will help in SwiftData apps too. I add the SQLDebug argument to pretty much every app I work on because it makes keeping an eye on your app's efficiency so much easier.
I hope these debug flags will help save you loads of time, just like they do for me. If you have questions, feedback or simply want to reach out to me, don't hesitate to contact me on Twitter